
AI powered search and chatbot tools are becoming a significant part of how users find and engage with websites. A study by Higher Visibility showed that 71% of Americans now use AI tools for searching.
Many marketers are now considering how LLM’s (Large Language Models) will crawl their website, alongside the more traditional search engine bots.
Traffic from these sources such as ChatGPT, Claude and Perplexity can be tracked in Google Analytics 4 (GA4) “Referrals” alongside other traffic.
However, visits from AI tools are relatively unique. AI platforms crawl, interpret and present your content in a different way to traditional search engines.
The queries searched within AI tools are often different too, taking a more informational or conversational approach. As such it can be much more useful to use a tailored approach to tracking this traffic,
This guide will walk you through configuring GA4 to consolidate AI referrals, making tracking and analysis much easier.
Setting Up an AI Referral Exploration in GA4
GA4’s standard reports don’t specifically categorise traffic from AI chatbots, so you’ll need to make a few changes if you want to track this data in its own area. The way I like to do this is within GA4’s explorations section.
To get started, log into your GA4 property and in the left-hand navigation menu, click on Explore. From here, you can create a new exploration.
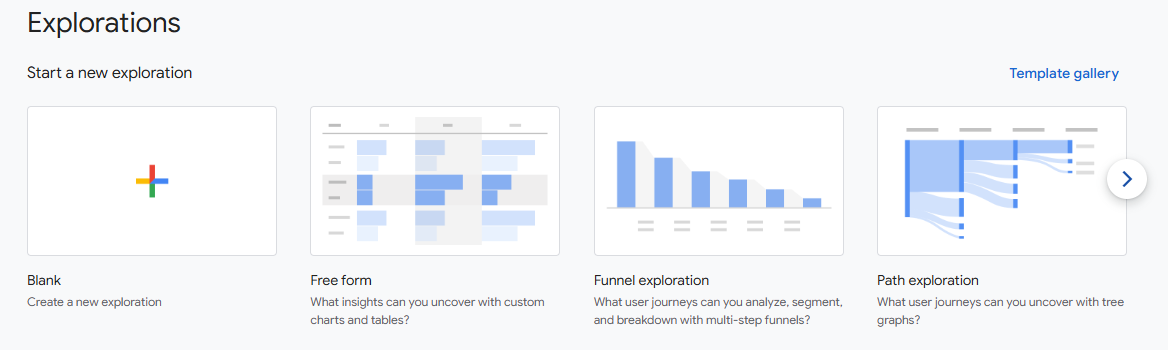
There are a number of different template options for explorations, but a blank exploration will work for tracking AI referrals.
Within the exploration, begin by giving it a name such as “AI referrals” that will make it easily identifiable.
Then, you need to configure the variables.
In the left hand “Variables” column, press the + button next to “Dimensions”, then select the following options:
- Page referrer – The URL of the referring website
- Landing page + query string – The page on your website the referral landed on
We also use a “Hostname” dimension to separate our different subdomains.
In the “Metrics” section below, click the + icon again, and this time select “Sessions”, which will show you the number of website visitor sessions driven by each dimension.

Depending on your business and the goals that you have, you may also want to add additional dimensions or metrics such as:
- Engagement rate – To find how visitors are engaging with the page
- Events – To track how many conversions or “key events” are coming from AI traffic
- Date + time – What times of the week drive the most AI referrals
Once you have selected the data you wish to include in your exploration, either double click on each variable’s name, or drag them into the free form section on the right.
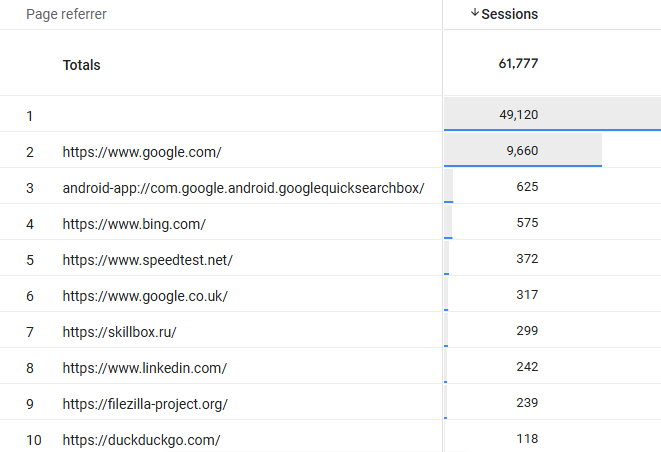
This will create a table with your chosen data points, however at the moment it will be showing all referrals, similar to what you can see in a regular GA4 report.
Identify AI Chatbot Referrals
To drill down to referrals from AI chatbots, you’ll need to use the filter function within your exploration.
Explorations allow you to set up to 10 individual filters. Due to the vast number of AI products that may send referrals, the best option is to use a Regex andset a “catch all” filter.
Click the + on filters, and select “Page Referrer”, then select “Matches regex” and enter the following
^https:\/\/(www\.meta\.ai|www\.perplexity\.ai|chat\.openai\.com|claude\.ai|chat\.mistral\.ai|gemini\.google\.com|bard\.google\.com|chatgpt\.com|copilot\.microsoft\.com)(\/.*)?$
This will pick up referrals from most of the major sources, including ChatGPT, Claude, Google Gemini and Bing CoPilot. This is a list that will evolve and can be updated as the most popular sources change.

Further Segments
If you’d like to drill down into your AI referrals further, you can also use the “Segments” setting.
Clicking the + button on this option will allow you to segment your data along lines such as Mobile only traffic, Desktop only traffic, or traffic from users who have previously visited your website.
The “Create new segment” option will allow you to take this even further, creating your own custom segments to help dig deeper into demographic information and much more


Add Visualizations
Depending on the type of data you’re looking for, you may want it represented in a different way – this is where “visualizations” play a part.
Within the “Settings” section of your exploration, you will see the “Visualization” bar, which allows you to change the formatting of your data with one click.

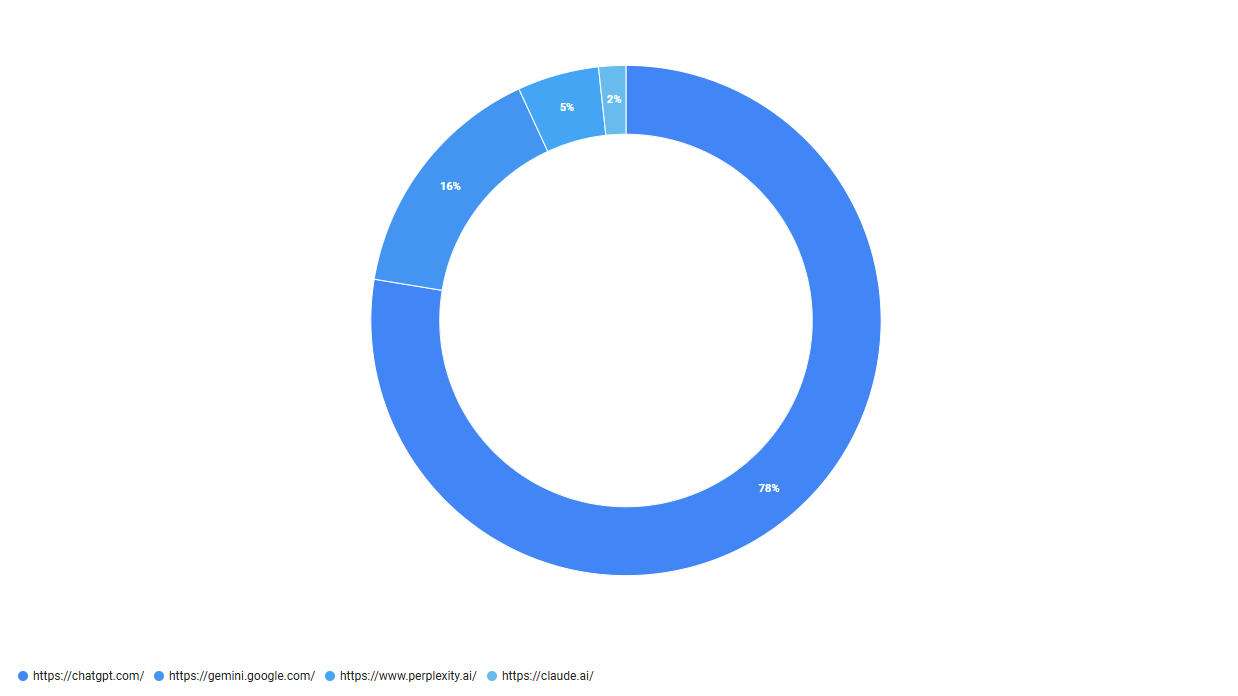
When I’m looking to find out exactly which pages are drawing the most traffic, then the standard table visualization is best. For a closer look at which sources are providing the most visits, the donut chart can be very effective.
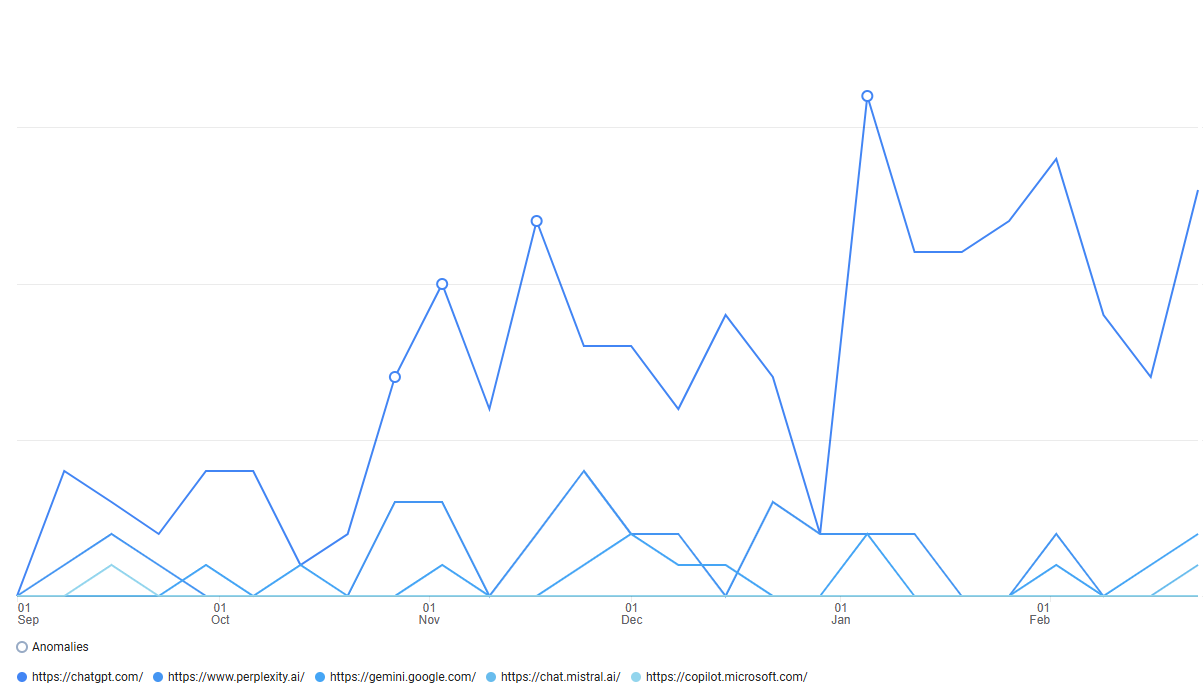
Meanwhile the line graph can be a really effective way of tracking the growth, or decline, of this traffic source over time.
Why AI Traffic Tracking Matters
By setting up AI referral tracking in GA4, you’ll gain better insights into this growing source of website traffic.
Whilst for many AI referrals are still a very small part of overall traffic, keeping track of chatbot referrals ensures you’re not missing key trends in user behaviour.
If you see that traffic from these sources is becoming particularly valuable to you, then you can use this information to further refine and tailor your content strategy.
Concerned about how AI is using your content? Learn how to prevent AI from scraping your website.


Add comment